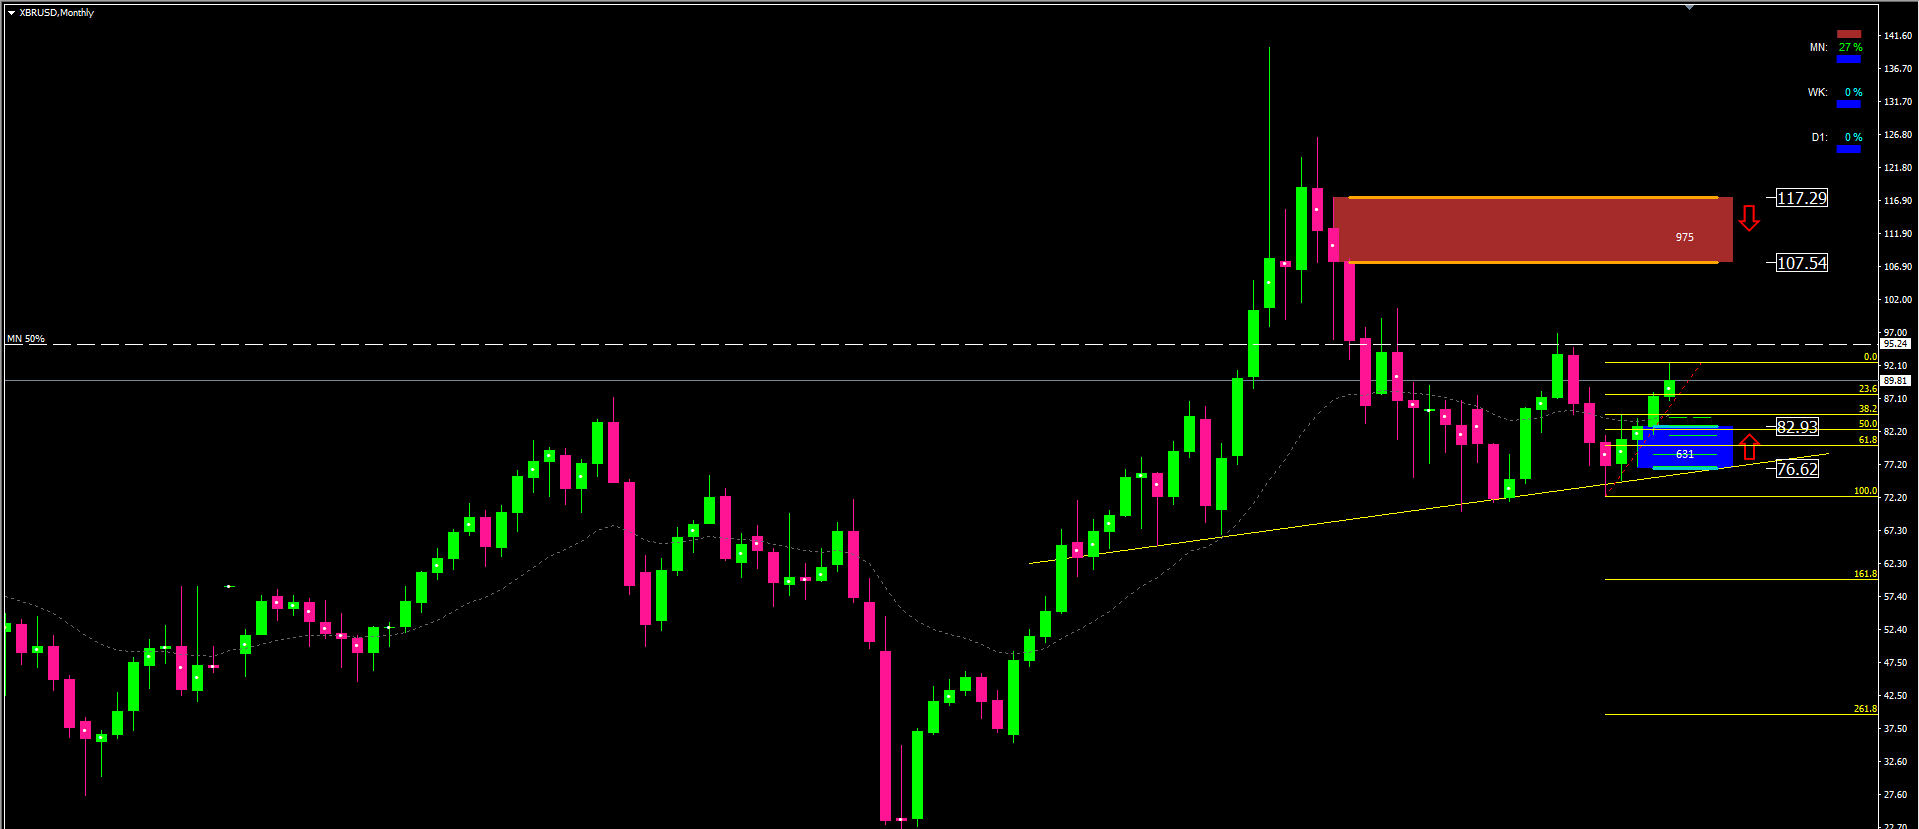
Looking at the monthly (MN) timeframe chart, the probability of the OIL/BRENT or XBR/USD pair rising according to the Double Bottom pattern to an untested supply zone is very high around 107-117.

The current position is the old peak zone, so the possibility of adjusting to the newly created demand zone around 77-83 in the near future is very high before continuing to rise.
To find the exact buying point, let’s consider the weekly timeframe for a clearer picture.
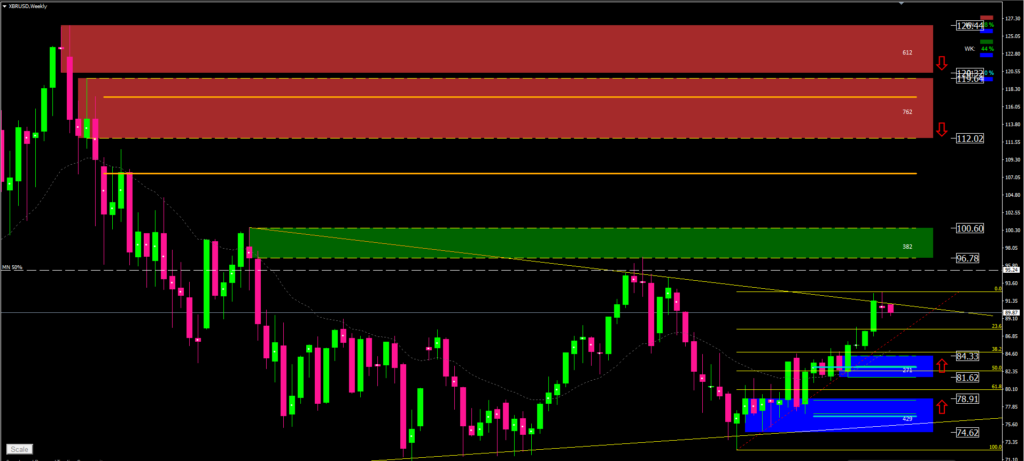
On the W1 timeframe, when encountering resistance, a bearish doji appears, the probability is that it will adjust to the demand zone around 82-84 that I have covered in blue first, but when verified with Fibonacci, the 61.8 position is a safer position around 75-79 because this position is the demand zone nested in the monthly timeframe that I have covered in blue second.
Let’s continue to consider the daily timeframe (D1) to find the exact buying point with the lowest stop loss position.
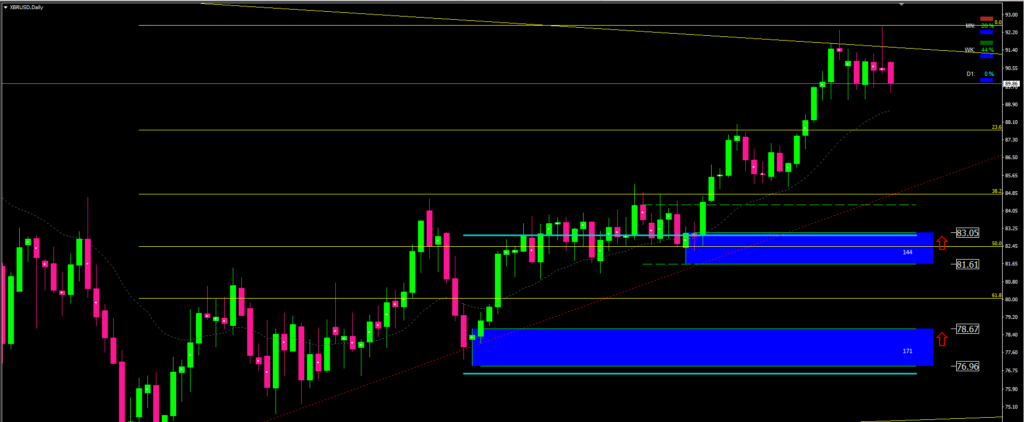
Looking at the D1 daily chart, there are two demand zone positions nested in the weekly and monthly timeframes around position 1 is 82-83 and position 2 is 77-79, where we will wait for the Price Action to show signs of a candlestick reversal before starting to buy up next with 2 profit-taking targets I have covered in red around 112-120 on the weekly timeframe chart.
To have a small slippage when news comes out and the lowest spread as well as interbank exchanges with high liquidity and reputation, I suggest using the following 3 exchanges to trade this risky Forex market:
- ICMarkets of Australia https://bit.ly/ICX1284
- ThinkMarkets of Australia https://bit.ly/ThinkMarketX
- RoboForex of Australia https://bit.ly/RoboForexX
- FxPro of UK https://bit.ly/FxProW
Those who do not yet have the background knowledge of the Forex financial trading market should take a free course that I share here before starting this 95% losing investment profession.
Disclaimer & Risk Warning
- It cannot be guaranteed that the methods or technical indicators presented in this course will generate profits or that learners will not experience losses during trading.
- There is no guarantee that this method will be suitable for everyone or help them become a successful trader.
- The historical performance of any trading system or method is not a guarantee of its future results.
- Do not trade if you cannot afford to lose financially. The examples mentioned in this material are for educational purposes only.
- There is no solicitation to buy or sell here. The instructor is not responsible for your trading results.
- Financial trading is a very risky activity, we recommend that you seek advice from a financial professional before making any investment decisions.
If you are successful from my sharing and if you want to receive more benefits from it, you can Donate to me through the wallet:
- BSC: 0xBe4Bf11b0629734361f2cAC750e2c971dEBDD592
- TRC: TAUACf2kWC5mbGgwiz2rQiTR21s7cvw6Gd
(This donation will be allocated to charity for SOS Vietnam and ShareTheMeal of the World).
I wish you all success and a safe landing on the new horizon! Good luck, everyone!